Zhixing Optics · CGH Precision Metrology Series
A Note Before We Begin
When "CGH" (Computer-Generated Hologram) is mentioned, many people immediately think of asphere testing. While this is indeed a vital application in precision optics, the value of CGH extends far beyond it.
As a diffractive optical technology capable of flexibly manipulating wavefronts, CGH enables us to create optical conditions that are difficult to achieve with conventional optical components. When wavefronts can be designed on demand, the scope of inquiry expands well beyond simply measuring an aspheric surface with greater accuracy.
What other objects are inherently difficult to measure? Can complex testing processes be simplified and accelerated? Can testing evolve from a mere "pass/fail" judgment into a tool that helps us identify root causes, understand errors, and drive improvements in manufacturing processes?
These are the questions that Zhixing Optics continues to explore within the realm of precision optical metrology and manufacturing. While not every challenge requires a CGH solution, the philosophy of wavefront design that it represents invites us to re-examine technical choices we have long taken for granted.
This is the motivation behind this series.
In optical metrology, many seemingly standard practices are actually rooted in specific physical principles and engineering trade-offs. Why was a particular design chosen? Are there other possibilities? When familiar methods reach their limits, can we approach the problem from a different perspective?
Some questions already have well-established answers, while others remain open to exploration. Starting with the topic of CGH, we aim to share our knowledge, experience, and insights—and, through this dialogue, uncover new questions along the way.
Whether you are a professional in optical design, manufacturing, or metrology; someone currently seeking a technical solution; or simply an individual with an interest in the field—we hope these discussions provide useful knowledge or spark fresh inspiration.
If these conversations prompt new ways of thinking, encourage new experiments, or even lead to tangible improvements in optical metrology and manufacturing, then our goal has been achieved.
Let’s begin with CGH and explore further.
— Zhixing Optics
CGH 01
Interferometers are already highly precise—so why is testing aspheric surfaces still so difficult?
Interferometers are capable of resolving extremely minute optical path differences. Intuitively, one might assume that a sufficiently precise instrument, when applied to a well-machined surface, should be able to detect any deviations.
In practical interferometry, however, while it is relatively straightforward to establish stable testing conditions for flat or spherical surfaces, the situation becomes significantly more complex when dealing with aspheric surfaces. The issue is not merely whether the instrument has "sufficient precision"—it concerns a more fundamental question: against what reference wavefront should the interferometer compare the surface under test?
Techniques such as null testing, the use of compensators, and computer-generated holograms (CGHs) all relate to this critical task of wavefront matching.
I. What exactly is an interferometer comparing?
An interferometer does not "see" the height of a surface directly. Instead, it records the intensity resulting from the superposition of a reference beam and a test beam, and then extracts the phase difference between the two. In an ideal model—assuming two fully coherent, polarization-matched beams—the process works as follows: [1]

Here, $I_r$ and $I_t$ represent the reference light intensity and the test light intensity, respectively, while $\Delta\phi$ denotes the phase difference between the two light beams. If $\Delta W$ is used to represent the corresponding optical path difference (OPD), then:
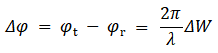
Phase-Shifting Interferometry (PSI) utilizes multi-frame intensity data and phase-shift information to reconstruct the phase difference, Δφ. An interferometer first determines the difference between a test wavefront and a reference wavefront; this data, combined with the measurement geometry, is then used to interpret the surface errors of the Unit Under Test (UUT).[1]
In a typical Fizeau configuration, a portion of the incident light is reflected by the reference surface of a standard optic to create a reference beam. The remaining light passes through this surface, illuminates the UUT, and—upon reflection—interferes with the reference beam. Transmission Flats (TF) and Transmission Spheres (TS) are used to establish the necessary standard measurement conditions.[1]
II. Why are flat and spherical surfaces so "easy to measure"?
Flat and spherical surfaces are the most classic subjects for interferometric measurement because three conditions are simultaneously met: their wavefronts are easy to generate, their standards are easily traceable, and their geometry allows for straightforward retroreflection (retracing the optical path).
Wavefronts with regular, well-defined constant-phase surfaces—specifically plane waves and spherical waves—can be reliably produced using collimating or focusing optics.
Well-established systems exist for the manufacturing, calibration, and application of Transmission Flats and Transmission Spheres. Metrology requires not only a wavefront but also knowledge of its accuracy and the ability to consistently reproduce it across different measurements.[1]
Given the appropriate geometric configuration, these two types of wavefronts possess a crucial property: the ability to retrace their own paths. As shown in Figure 1, a plane wave incident normally upon a flat mirror reflects back along its original path. Similarly, when the center of curvature of a spherical wavefront coincides with the center of curvature of the spherical surface under test, the individual test rays strike the surface at near-normal incidence and reflect back along their original paths.[1]
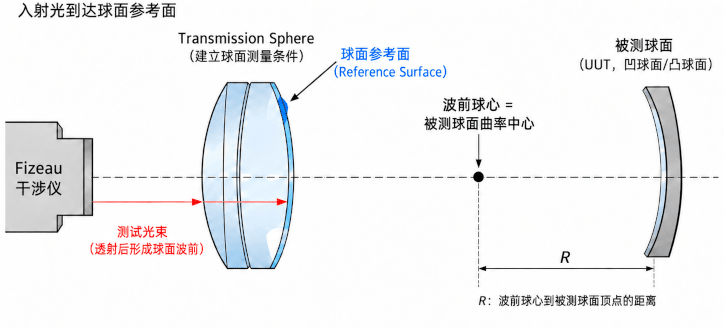
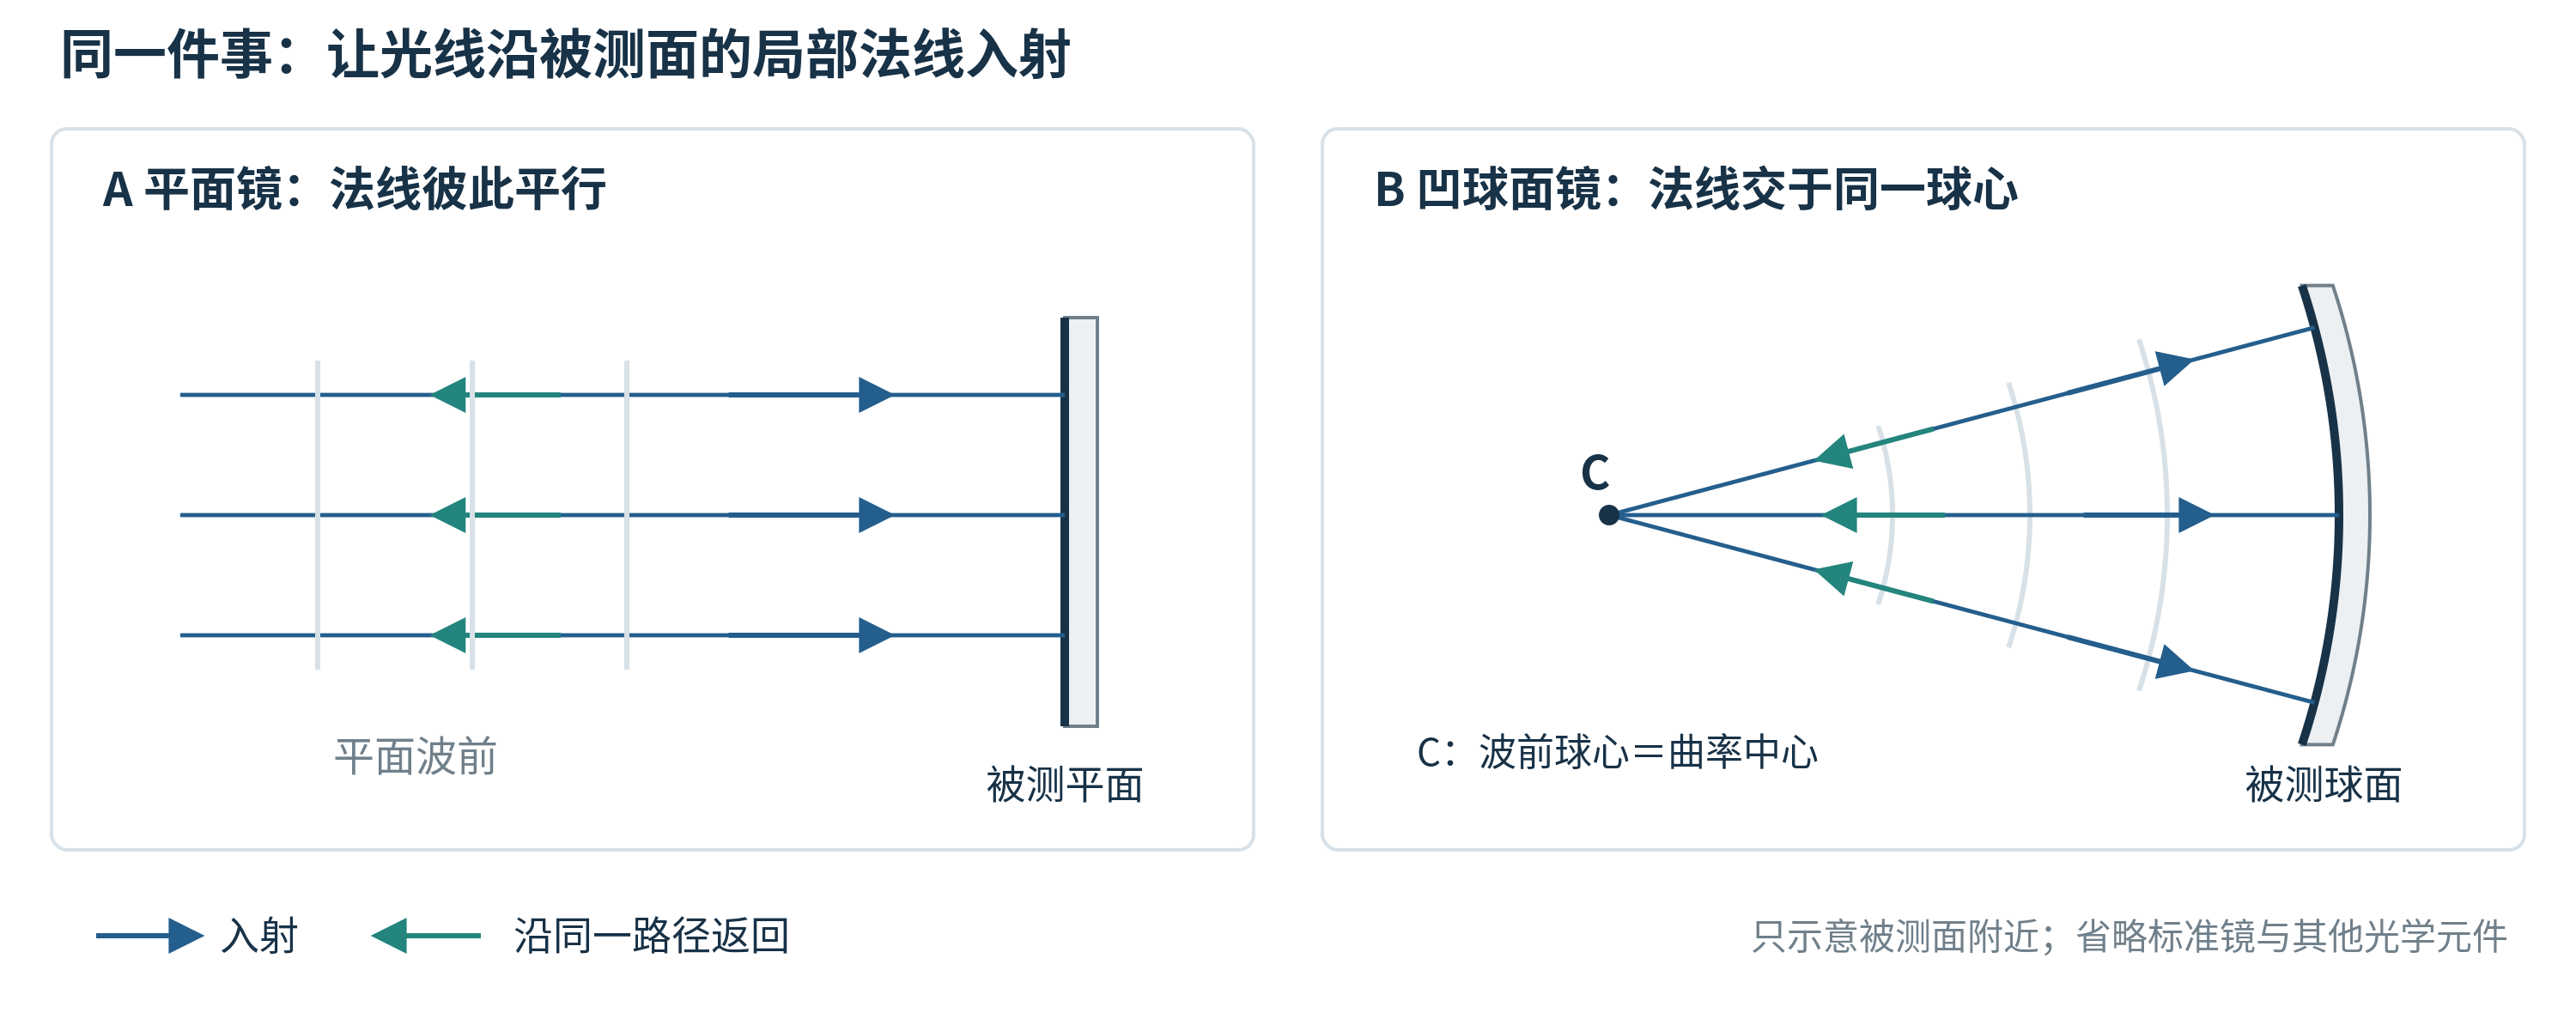
Fig. 1 | Top: Reference configuration for Fizeau testing of a spherical surface; Bottom: Retro-reflective geometry for planar and spherical surfaces. The lower diagram illustrates only the light rays in the vicinity of the surface under test (SUT) and does not represent the wavefront at the detector plane. [1]
Under such matching conditions, an ideal surface will not exhibit a significant deterministic wavefront difference, making it easier to distinguish actual manufacturing errors during measurement.
III. Why do aspheric surfaces present greater challenges?
Aspheric surfaces alter the geometric conditions that the test wavefront must satisfy. In general, the surface normals of an aspheric component do not all converge toward a single center of curvature. Consequently, if standard spherical testing configurations are applied, a deterministic mismatch between the returning test wavefront and the reference wavefront may arise—even when the unit under test (UUT) perfectly conforms to its design specifications.
Given a consistent comparison plane, coordinate system, and reference convention, let the wavefront for a standard spherical surface be denoted as  The target-test wavefront is denoted as
 Design mismatch can be conceptualized as follows:

This design mismatch is not the same as a manufacturing error. The measured wavefront difference may encompass both the deterministic mismatch inherent in the nominal surface profile and the actual fabrication errors; these two components must be distinguished during measurement and data interpretation.
When the mismatch is small, aspheric surfaces can still be tested using flat or spherical reference optics under "non-null" conditions. As the mismatch increases, factors such as fringe density, back-reflected light, and system errors may gradually approach the limits of what can be measured. Whether a measurement is feasible depends on the specific conditions, rather than simply on the fact that the surface is "aspheric."[2]
IV. How does wavefront mismatch manifest in an interferogram?
Wavefront mismatch primarily manifests as changes in the fringe pattern. Fringe density depends on the rate at which the optical path difference (OPD) varies across space, rather than solely on the magnitude of the OPD itself. Adding a uniform OPD across the entire aperture merely shifts the overall phase; it is the rate of local variation, $\Delta W(x,y)$, that determines the spacing between fringes—the faster the variation, the narrower the fringe spacing.
Within a given measurement coordinate plane, the optical path difference between adjacent bright fringes (or adjacent dark fringes) corresponds to one wavelength. In the direction perpendicular to the local fringes, the fringe spacing is approximately: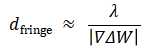
Figure 2 shows interference intensities generated point-by-point from the same set of resolved optical path differences. Here, A is a constant, while B and C share the same spatial distribution; the gradient of C is four times that of B, which corresponds to a reduction in the local fringe spacing to one-fourth of its original value. Each plot represents an ideal model calculation rather than experimentally measured data.
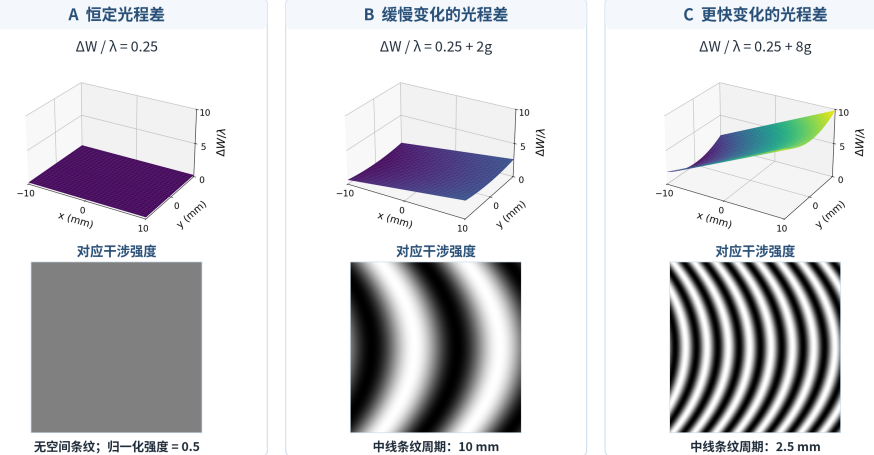
Figure 2 | Optical path difference (OPD) and interference fringes generated from the same dataset. The aperture, vertical scale of the wavefront difference, and intensity grayscale are kept consistent. A constant OPD produces no spatial fringes, while an increasing gradient leads to a higher density of local fringes. This is an idealized example constructed for this text, not based on actual measured data.
The same spatial variation can also be interpreted in terms of light-ray direction. On a common reference plane, the wavefront normal of each beam defines its local propagation direction; the difference in wavefront slopes between two beams reflects the discrepancy in their directions. Thus, an increase in fringe density and a directional mismatch are both linked to the same spatial variation in the wavefront difference. In a practical test setup, such a mismatch can also lead to a loss of returning light, "retrace errors" (where the returning light deviates from the incident path), as well as errors in imaging and coordinate mapping. [1]
Therefore, the feasibility of a direct measurement depends on several factors: whether the fringes can be adequately sampled, whether the test beam can be effectively returned, and whether the systematic errors introduced by a non-null optical path remain within the required accuracy limits. Null testing not only reduces the fringe density caused by design mismatches but also ensures that the ideal test optical path remains close to a "retrace" condition.
V. Is a CGH always necessary when there is a wavefront mismatch?
Not necessarily. If the mismatch can still be reliably sampled and modeled, a non-null measurement approach may be used. For certain types of surfaces, specific conjugate relationships can be exploited to establish a "natural" null condition. When compensation is required, a compensator—such as a Computer-Generated Hologram (CGH)—can be introduced to generate a matched test wavefront. [2]
Beyond interferometry, techniques such as profilometry, 3D topography measurement, and slope measurement can also provide information about complex surfaces. These methods rely on different physical quantities and data-processing approaches; each is suited to specific apertures, spatial scales, manufacturing stages, and measurement tasks. Consequently, they cannot be simply ranked by "level of accuracy." [3–6]
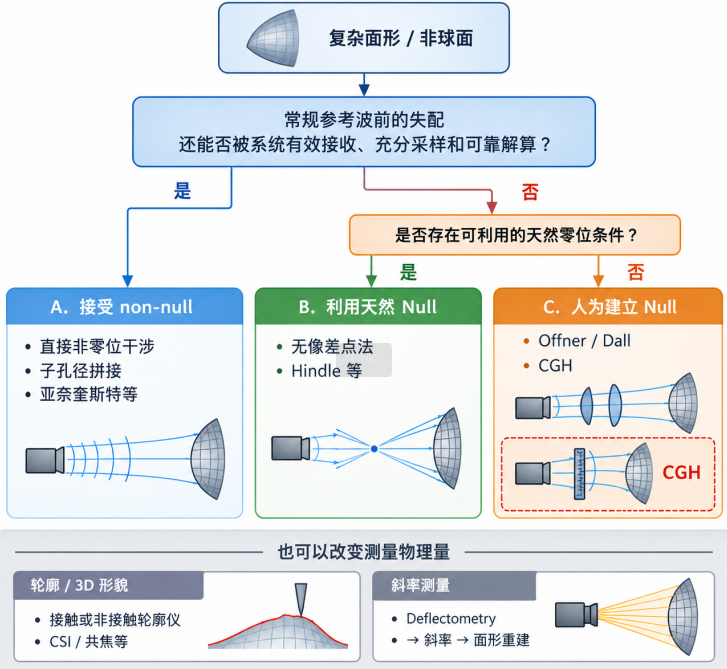
Figure 3 | Primary approaches for measuring complex surface geometries. The use of a Computer-Generated Hologram (CGH) represents a compensation strategy that artificially establishes a "null" (zero-fringe) condition. The various paths shown in the figure illustrate different measurement philosophies; the selection of a specific method is not determined by a single threshold value.
Among these approaches, the CGH offers the flexibility to tailor the test wavefront to the nominal geometry of the surface under test (SUT). This allows complex, non-spherical surfaces to be brought back into a state suitable for interferometric comparison.
VI. How does a CGH re-establish wavefront matching?
In a typical optical setup combining a Fizeau interferometer with a CGH, the reference wavefront is generated by reflection from the reference surface of a high-precision standard optic (reference element). The test beam, having passed through this reference surface, then traverses the CGH, which transforms it into a target test wavefront that matches the ideal (nominal) geometry of the unit under test (UUT). [1,2]
Figure 4 (left) depicts an optical test configuration—reconstructed based on data released by NASA regarding the testing of the James Webb Space Telescope (JWST) mirror segments—in which a CGH acts as a diffractive null-compensation element. It converts a spherical test wavefront into one that matches the nominal aspherical surface, ensuring that the test beam strikes the surface at near-normal incidence (at the design-specified locations) and reflects back along the original path. The diagram on the right illustrates the relationship between the reference beam and the test beam using a standard Fizeau configuration; it is not intended to represent the actual internal architecture of the NASA instrumentation. [1,7]
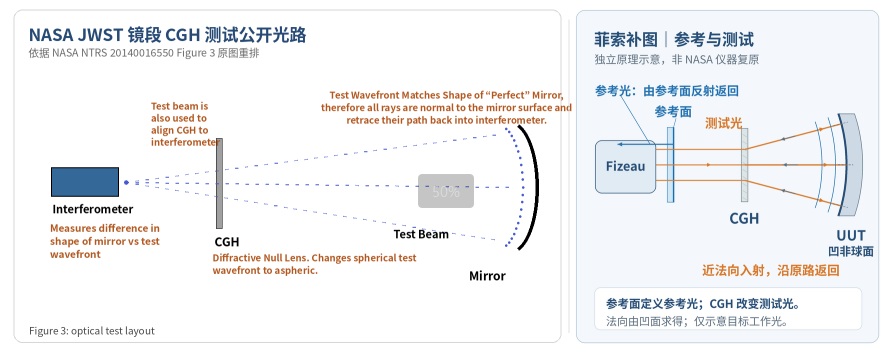
Figure 4 | Compensation of the test wavefront using a CGH. Left: A schematic of the test optical path for the original NASA mirror segment; Right: A separate schematic based on the Fizeau principle, where the test beam is incident along the local normal to the concave surface, and the returning beam follows the same path. The NASA instrument is not replicated in the right-hand schematic. [1,7]
Under the same reference plane and coordinate convention, let the incident nominal wavefront be denoted as The function of a CGH can be conceptually represented as:

The equation above summarizes the equivalent compensation under design conditions. The CGH compensates for deterministic mismatches relative to the nominal surface form; any deviations of the actual surface from this nominal form remain in the returning wavefront, constituting the signal that needs to be measured.
Factors such as the fabrication and calibration of the actual component, non-working diffraction orders, alignment, and coordinate mapping also influence the measurement results and must be incorporated into the error analysis [1,2].
A CGH transforms an otherwise excessive design wavefront mismatch into a set of compensation relationships that can be designed, fabricated, aligned, and calibrated. While it provides manageable measurement conditions, it does not cause errors to vanish automatically.
Reference Wavefront, Target Test Wavefront, and Nominal Surface Form
The reference wavefront pertains to the reference beam that actively participates in the interference; the target test wavefront is the wavefront designed for an ideal UUT (Unit Under Test) within the optical test path; and the nominal surface form serves as the geometric baseline against which actual surface deviations are evaluated. These three are interrelated but cannot be used interchangeably.
VII. Does CGH compensation directly yield the surface form?
Following compensation, the interferometer still recovers the phase difference between the reference beam and the returning test beam. This must be converted into an optical path difference (OPD) and then—by accounting for measurement geometry, coordinate mapping, as well as reference and calibration corrections—interpreted as the surface error of the UUT [1].
Phase Difference → Optical Path Difference / Wavefront Difference → Measurement Model and Error Correction → Surface Error
How, then, is that "surface form map"—displayed on a screen with a nanometer-scale color bar, PV (Peak-to-Valley) values, and RMS (Root Mean Square) values—actually derived from this phase information?
Next Article | Where do the "surface form maps" in an interferometer really come from? References
[1] Ping Zhou. Error Analysis and Data Reduction for Interferometric Surface Measurements. Ph.D. Dissertation, University of Arizona, 2009.
[2] Peng Jiantao. Research on Testing and Co-phasing Techniques for Large-Aperture Optical Systems Based on Computer-Generated Holography (CGH). Ph.D. Dissertation, University of Chinese Academy of Sciences, 2017.
[3] Polytec. Optical surface metrology complements tactile measurement techniques. Interviews and technical documentation (providing additional perspectives for selecting measurement approaches).
[4] Polytec. What is chromatic confocal technology? Technical note (explaining the principles of confocal measurement).
[5] Polytec. Why use CSI (Coherence Scanning Interferometry)? Technical note (covering white-light interferometry and 3D surface topography measurement).
[6] Peng Su, Robert E. Parks, Lirong Wang, Roger P. Angel, James H. Burge. Software configurable optical test system: a computerized reverse Hartmann test. Applied Optics, 49(23), 4404–4412, 2010. DOI: 10.1364/AO.49.004404.
[7] Ritva Keski-Kuha, Babak Saif, Lee Feinberg, et al. New Method for Characterizing the State of Optical and Opto-Mechanical Systems. Proc. SPIE Astronomical Telescopes and Instrumentation, 2014. NASA NTRS 20140016550, Figure 3. Public use permitted.